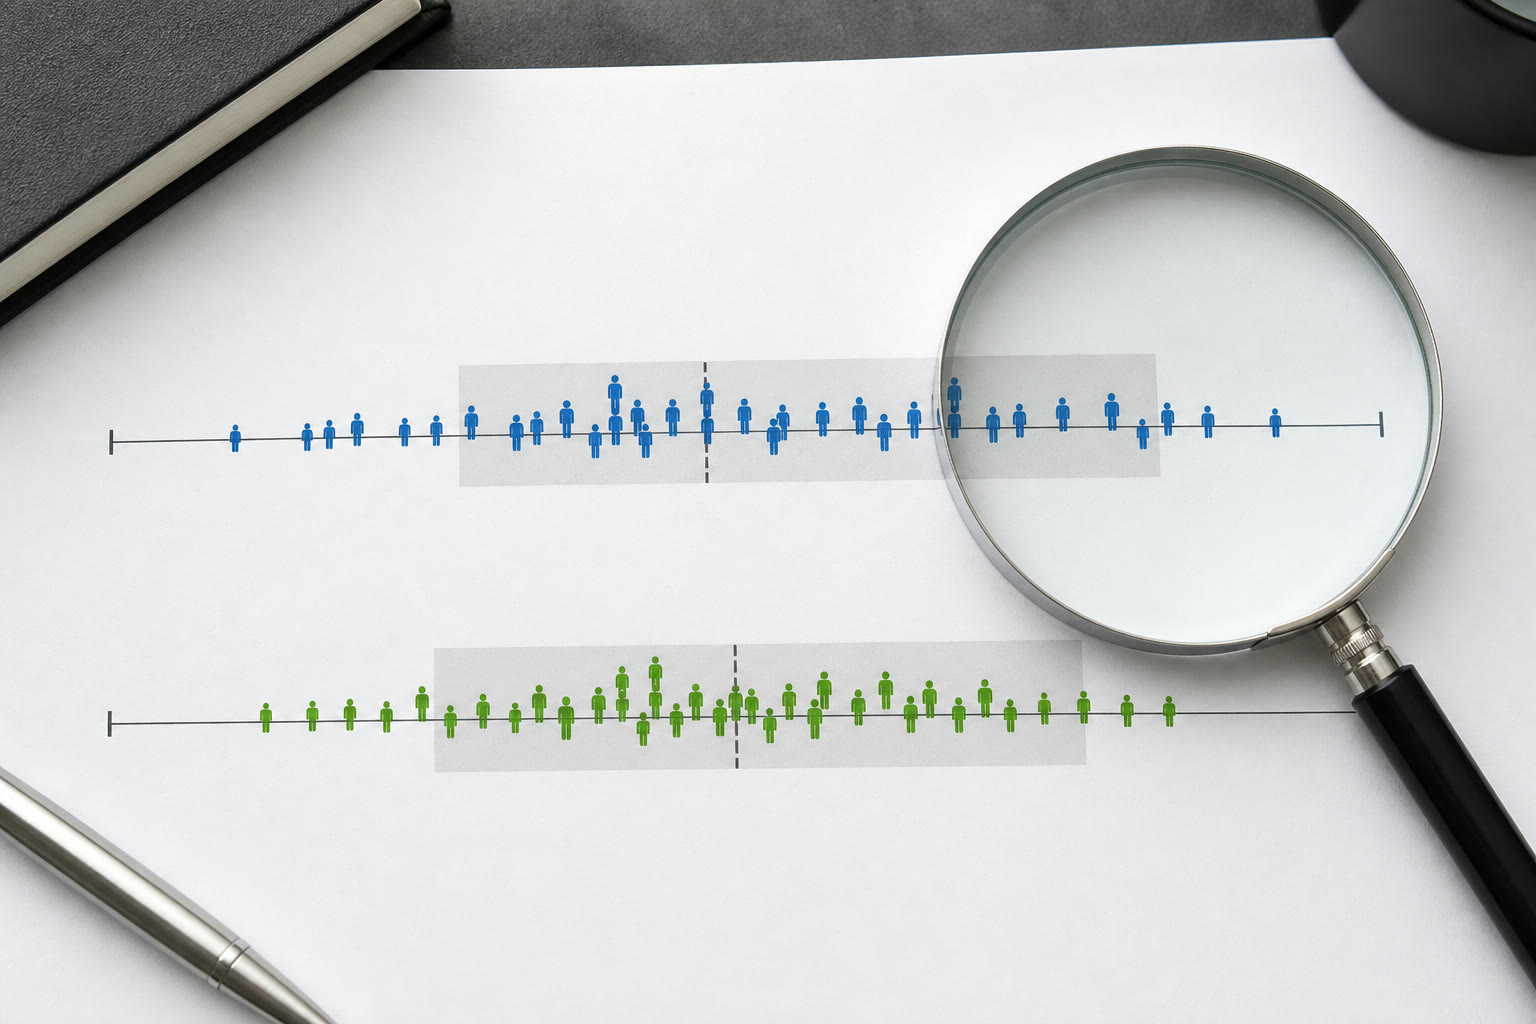
Lifespan describes how long an individual lived or may live. Life expectancy summarizes mortality patterns for a population under a defined method. Treating them as the same creates false personal certainty.
Lifespan is an individual duration
A completed lifespan is the elapsed time between birth and death for one person or organism. Before that endpoint is known, a proposed lifespan is a scenario or assumption, not a measurement.
The longest observed lives and average lives answer different questions. An extreme record cannot be used as a likely outcome, and a population average does not set a personal maximum.
Life expectancy is a population statistic
Life expectancy at birth summarizes the average years a newborn would live if the mortality rates used in the calculation continued to apply. It reflects a population, period, source, and method rather than a promise to each newborn.
The estimate can change as mortality patterns, data quality, and models change. Two sources may publish different values because they use different years, revisions, populations, or assumptions.
Remaining life expectancy is conditional
A person who has already reached age 70 has survived risks included in the at-birth average. Their remaining life expectancy is therefore not calculated simply by subtracting 70 from life expectancy at birth.
Age-conditional life tables estimate remaining years for people who have reached a given age. They still describe groups and cannot include every personal health, social, environmental, and future factor.
Why country and sex groups differ
Mortality data can vary with healthcare access, conflict, income, environment, occupation, behavior, and many other conditions. Statistical sex categories may be used because source life tables publish separate series, but they do not capture an individual's full identity or biology.
Comparisons should preserve the indicator definition and observation year. Ranking countries from mismatched periods or presenting a modeled estimate as a direct census count can create a false sense of precision.
How calculators should present the number
A responsible calculator names the indicator, country or region, population group, source, and data year beside the result. Approximate months, weeks, or days should remain labeled as conversions of the same uncertain statistic.
It should not generate a death date, guarantee remaining time, or imply diagnosis. A selected planning horizon and a public-data estimate must be shown as different inputs even when both appear on one page.
Using the information constructively
Use life expectancy to understand demographic context or to test broad planning scenarios. Financial plans can model several horizons rather than spending to one average; health decisions need clinical evidence rather than a country statistic.
If a life-calendar visualization causes fear or compulsive checking, choose a shorter planning horizon or stop using it. The useful lesson is uncertainty plus perspective, not a countdown to an unknowable personal endpoint.
Period and cohort life expectancy
Period life expectancy summarizes mortality rates observed for different ages in a particular period. It does not assume that today's rates will remain unchanged for one real birth cohort. Cohort life expectancy follows a group born in the same period and incorporates the mortality conditions they experience over time, which requires completed history or projections for future ages.
Public tables may report life expectancy at birth or at a later age. The source, reference year, sex or population group, and method all matter. Two values can differ because they answer different statistical questions, not because one is necessarily incorrect. A calculator should carry those labels into the result.
Why subtraction gives the wrong remaining-years answer
Life expectancy at age 60 is not simply life expectancy at birth minus 60. Reaching age 60 means the person has already survived risks included in the birth statistic. Actuarial life tables calculate remaining years from the survival experience of people who reached that age under the table's assumptions.
This conditional idea explains why a displayed progress percentage based on life expectancy is only a visualization. It cannot divide a real life into a guaranteed used and remaining portion. Future health, environment, access to care, and population-level mortality changes are not known for an individual visitor.
Use population data for the right purpose
Life-expectancy figures can support demographic comparison, public planning, and broad retirement scenarios. They are not a medical diagnosis and should not be used to decide that a symptom, treatment, or preventive visit is unnecessary. Personal health questions belong with qualified professionals who can consider actual history and current evidence.
For financial planning, use multiple longevity scenarios rather than a single endpoint. A conservative plan may test several ages and review the assumptions over time. Label the public-data year and country or population scope so the estimate can be updated when a source publishes a revised series.
How to read a calculator responsibly
Look for separate labels for observed age, population life expectancy, estimated remaining years, and chosen planning horizon. Confirm whether the tool uses life expectancy at birth or conditional expectancy at the user's current age. Check source links and dates. A result without these distinctions can look personal while actually repeating a broad average.
Treat the output as context for reflection, not a countdown. Share only the country, age group, or result detail needed for the conversation. A trustworthy interface explains uncertainty in ordinary language, avoids claims of prediction, and makes it easy to change assumptions without implying that a different selection changes a person's actual future.
Questions to ask about any displayed estimate
Identify who produced the table, which population it covers, the reference year, whether the value is period or cohort based, and whether it is measured at birth or the user's current age. Check whether the tool interpolates missing years or substitutes a regional aggregate. These details determine what comparison is being made and should be available without forcing the reader to inspect source code.
Next, separate the observed statistic from user-controlled scenarios. A planning horizon selected as age 90 is not a forecast, and a progress bar drawn against it is not a survival probability. Likewise, a country average does not describe access to care, occupation, family history, or current health. The result should use words such as population estimate and scenario consistently.
Finally, review the date. Mortality tables and international datasets are revised, and the most recent value can lag several years. A transparent calculator shows the data year and does not label a model-updated counter as a new official observation. Responsible presentation helps users learn from population context without converting uncertainty into a personal promise.
A better planning view
Instead of one dramatic remaining-time number, show several neutral horizons and let users enter their own. Pair each horizon with practical units such as years or weekends while repeating that the endpoint is selected, not predicted. This keeps the reflection useful without presenting a population average as a personal deadline.
Review the estimate only when it serves a real planning question, such as testing whether savings last under different longevity scenarios. More frequent checking does not make the statistic more personal or accurate. Good use of demographic data comes from understanding its scope and uncertainty, then combining it with appropriate professional advice where decisions carry risk.
Key takeaway
Lifespan is an observed individual outcome; life expectancy is a population statistic built from mortality data and assumptions. Check whether a figure is period or cohort based, measured at birth or conditional on current age, and tied to which population and year. Use several planning horizons rather than one predicted endpoint. Do not interpret a progress bar as survival probability or medical guidance. A responsible calculator keeps source data, user scenarios, and observed age visibly separate so readers gain demographic context without being told that an average determines their future.
Sources and further reading
These references support the calendar rules, cultural context, or public-data definitions discussed in this guide.
- World Bank: Life expectancy at birthCountry-level life expectancy at birth series and observation years.
- WHO: Life expectancy and healthy life expectancyDefinitions and global health estimates for life expectancy measures.
- United Nations: World Population ProspectsPopulation estimates and demographic methodology.