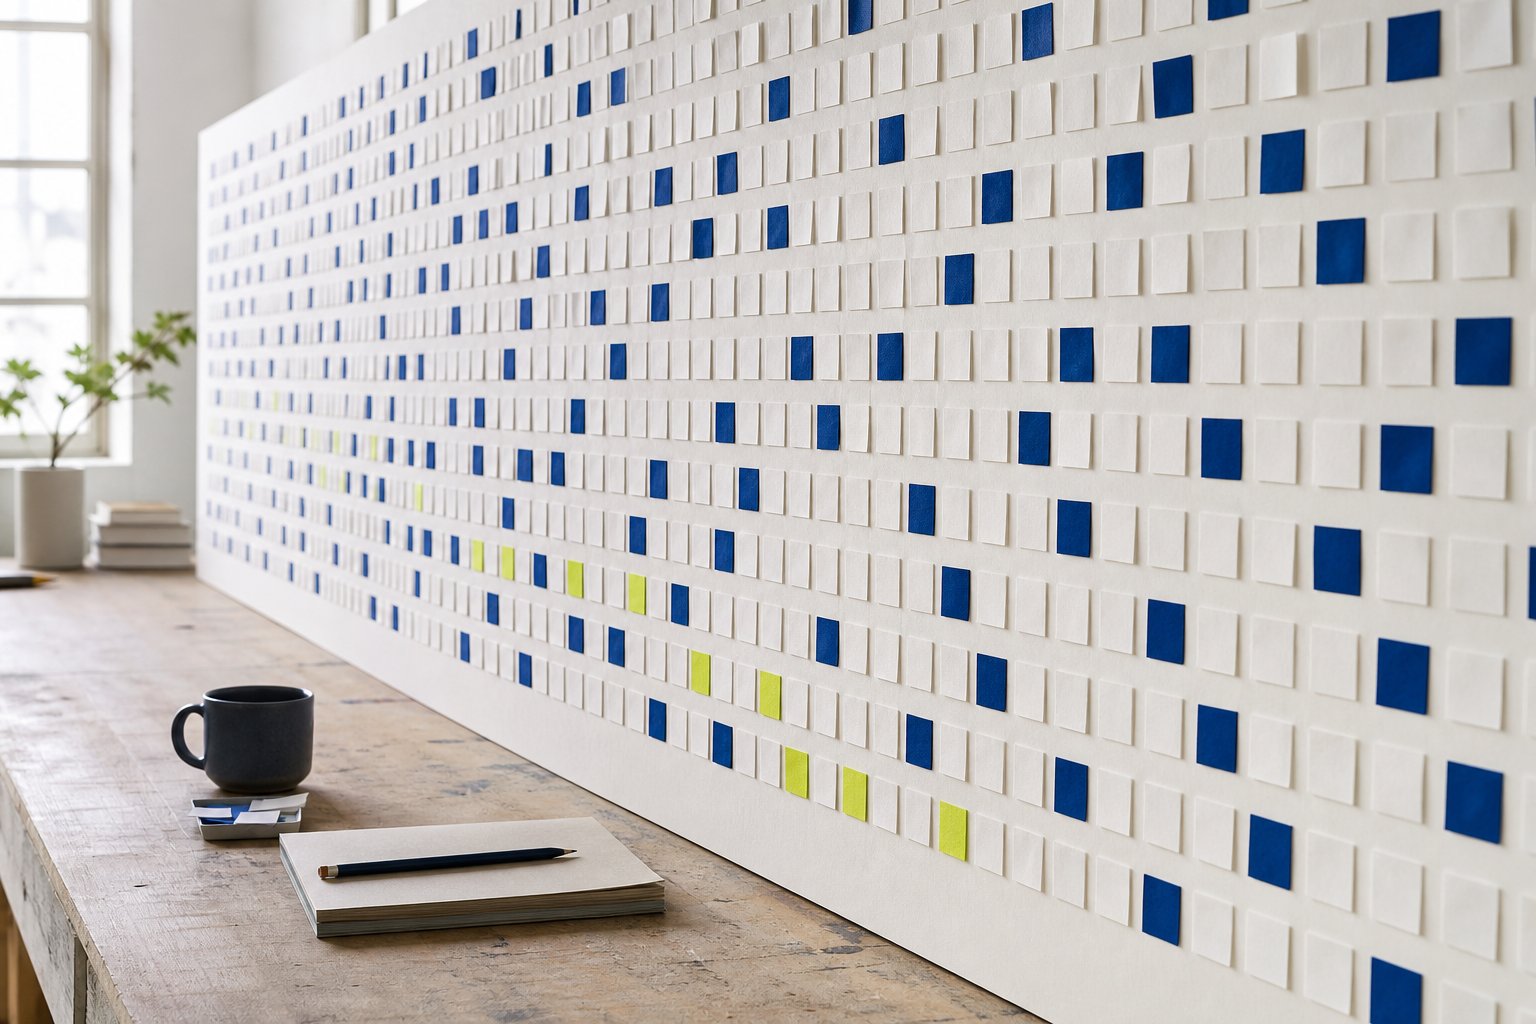
A life calendar turns a selected lifespan into weeks. It should be framed as a reflective planning aid, not a countdown or guarantee.
What the grid represents
A life calendar divides a user-selected lifespan into weeks, usually displayed as small cells. Filled cells represent weeks already lived and unfilled cells represent the remainder of the planning estimate.
The visualization compresses decades into one view, which can make ordinary weeks feel more tangible than a distant number of years.
The lifespan is an assumption
An 80-year setting is a convenient illustration, not a prediction. Users can choose another planning horizon, and the visual should update without implying that the final cell is a known personal end date.
Population life expectancy and a user-selected lifespan answer different questions. Neither can determine an individual's future.
A constructive way to use it
The grid can support planning for recurring priorities: family visits, health appointments, learning blocks, creative projects, rest, or travel. The point is to notice patterns and make room for what matters.
Avoid turning every unfilled week into pressure. A calm calendar is a reflection aid, not a productivity score or a measure of whether time has been used correctly.
Privacy and sharing
The calculation needs a birth date and lifespan assumption. It can run entirely in the browser, but a downloaded card may reveal age or timing information.
Before sharing, decide whether the audience needs the exact numbers. A private screenshot or a simple percentage may be more appropriate than a full birth-date-based result.
Revisit the calendar when the chosen planning horizon changes rather than treating the first image as permanent. The most useful comparison is often how priorities changed between reviews, not whether every planned week went exactly as expected.
Why weeks change the scale of a life
Years are useful for age but can feel too large for ordinary planning. Days are exact but create numbers so large that patterns disappear. Weeks sit between those scales: long enough to contain work, rest, relationships, and routines, yet small enough to mark individually. A grid makes elapsed time visible without requiring a person to scan thousands of dates.
An eighty-year horizon contains a little over four thousand weeks, depending on the exact birth and end dates. That number is memorable, but it is not a universal lifespan. The calendar should be generated from the user's chosen horizon and display that assumption beside the grid. Otherwise an attractive visualization can quietly turn a planning example into a false prediction.
Reading the grid without overinterpreting it
Filled cells represent weeks that have elapsed since the birth date under the tool's date rules. Unfilled cells represent only the remainder of the selected horizon. They are not guaranteed future weeks, and a filled cell does not say whether that week was productive, happy, difficult, healthy, or wasted. The grid measures time, not the quality or moral value of a life.
A current partial week may be counted according to elapsed-day logic, so users should read the accompanying numbers rather than estimating from color alone. Accessible text, labels, and progress semantics are important because a dense field of squares cannot carry the whole meaning for screen-reader users or people with color-vision differences. The visualization should support the result, not replace it.
A constructive reflection exercise
Choose one recurring priority and mark a realistic cadence outside the calculator. This might be a monthly family visit, a seasonal health review, a weekly learning block, or one unscheduled weekend each month. Start with the next twelve weeks rather than trying to assign every cell in the horizon. Short planning windows can respond to changing health, work, money, and relationships.
At the end of the window, ask what the pattern made easier and what created pressure. Keep the useful commitment, change the unrealistic one, and leave margin for events that cannot be planned. The life calendar is most helpful when it turns perspective into one humane adjustment. It becomes harmful when every empty square is treated as an obligation to optimize.
Selecting a horizon for the right reason
A round number such as 80, 90, or 100 years can be useful for comparing scenarios. A population life expectancy can provide public-data context, but it still does not predict an individual outcome. Health history, living conditions, future medicine, migration, and chance are not captured by a simple endpoint. Choose a horizon that serves the reflection and be willing to change it.
Comparing two horizons can be more honest than fixating on one. For example, view 80 and 90 years to see which priorities remain important under both scenarios. Financial and medical decisions need qualified advice and scenario planning that is much richer than a week grid. The calendar can start a conversation, but it should not close one.
Privacy, sharing, and emotional safety
A life calendar derived from a full birth date can reveal age and timing information. Before downloading or posting it, decide whether the audience needs the detailed grid, a percentage, or simply the idea. Remove identifying context when possible, and do not create public calendars for another person without consent. Local browser calculation reduces collection by the site, but it cannot control what happens after a result is shared.
The visualization can feel motivating to one person and unsettling to another. Stop using it if it creates anxiety, compulsive checking, or a sense that rest has no value. People dealing with grief, illness, or uncertainty may prefer a shorter planning horizon or a different tool entirely. A responsible life calendar invites perspective without fear, urgency, or claims that a final date is known.
Designing a personal review around the calendar
Begin with facts the tool can calculate: birth date, as-of date, selected horizon, weeks lived, and estimated remaining weeks. Write the horizon at the top of the review so it cannot be mistaken for a prediction. Then choose three areas that matter now, such as relationships, health support, and learning. Avoid building a list large enough to make the visualization feel like an accusation.
For each area, select one observable rhythm for the next quarter. This might be two phone calls a month, one protected walk a week, or a six-week class. Put those actions in a normal calendar with travel and recovery time. The week grid provides perspective, while the ordinary calendar creates the commitment. Using both prevents an inspiring large-scale picture from becoming detached from real capacity.
At the end of the quarter, record what happened without coloring old weeks as successes and failures. Circumstances change, and a week spent recovering or caring for someone is not empty. Ask whether the rhythm supported the value, whether it should continue, and what needs more margin. The review should improve the next decision rather than judge the past.
If the full horizon feels emotionally heavy, switch to a one-year or five-year planning view. There is no requirement to stare at a lifetime grid. A useful tool adapts to the person, provides an exit, and avoids push notifications or alarming messages. Perspective is beneficial only when it remains voluntary and humane.
Share the exercise, not another person's numbers. Couples or families can discuss recurring priorities without comparing progress percentages or estimating each other's endpoints. Consent and context matter. The life calendar is a private reflection aid first; any public card should reveal less information than the working calculation.
Additional practical checks
Recalculate when the date or horizon changes, but do not refresh compulsively. Quarterly or annual review is usually enough to notice priorities. The grid gains meaning from the conversation and actions around it, not from watching another cell fill each week. Put the next review date in an ordinary calendar and close the visualization until then.
Sources and further reading
These references support the calendar rules, cultural context, or public-data definitions discussed in this guide.
- U.S. Naval Observatory: Introduction to CalendarsGregorian calendar, leap-year, and calendar-cycle reference.
- ISO: Date and Time RepresentationOverview of internationally standardized date representation.