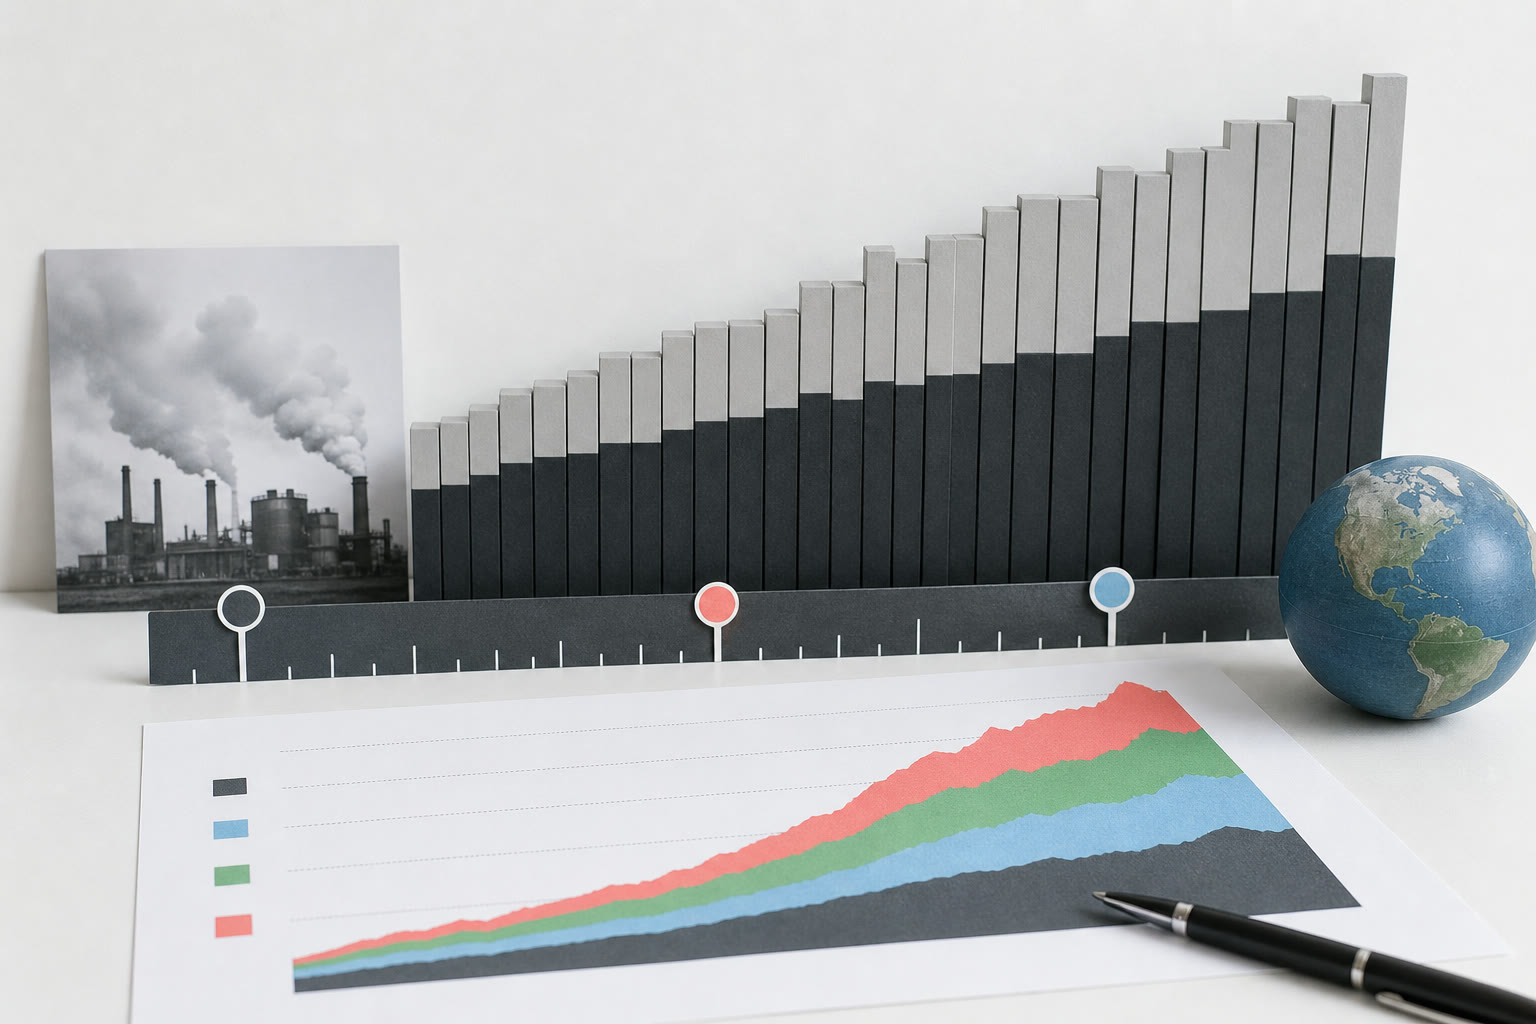
A CO2-since-birth figure connects a personal timeline with global annual emissions data. It describes worldwide emissions during that period, not emissions caused by the individual.
What the result measures
The calculation sums annual global fossil CO2 emissions from the birth year through the latest available observation. If the date falls within a year, the first year's value may be prorated rather than counting a full year before the person was born.
The total belongs to the global timeline. It is not a personal footprint, moral score, or estimate of household consumption. The label must keep that distinction visible.
Annual versus cumulative emissions
Annual emissions describe the flow released during one year. Cumulative emissions add those flows across years. A percentage of historical cumulative emissions asks how much of the dataset's total occurred after the selected birth date.
That share depends on the dataset's starting year, included sources, gas definition, and latest observation. A page should name those boundaries instead of presenting the percentage as universal.
Interpolation and partial years
Annual public datasets do not provide a value for every day. A browser tool can estimate the fraction of the birth year remaining and the fraction of the latest year elapsed, then apply those fractions to annual totals.
This produces a smoother personal timeline but does not create daily measurements. The result should say estimated and identify the last fully published year, especially when a live-looking counter extends beyond it.
Dataset definitions matter
Fossil CO2, land-use change, territorial emissions, consumption emissions, and all greenhouse gases are different measures. Combining one source's fossil series with another source's broader cumulative total can make the share internally inconsistent.
Use one compatible series for the numerator and denominator or explain every conversion. Preserve units such as tonnes of CO2 rather than switching silently to tonnes of carbon.
How to verify the calculation
Inspect the annual series, identify the birth-year row, and sum through the latest observed year. Compare the result with the cited dataset release and check whether partial-year treatment accounts for any small difference.
Keep the retrieval or release date because historical estimates can be revised. Two totals based on different dataset versions may differ even when both calculations use the same method.
A constructive interpretation
The timeline can show how rapidly global emissions accumulated during different generations and why historical context matters. It cannot assign responsibility to a person based on age or birthplace alone.
For personal action, use a dedicated footprint method with relevant activity data and clear boundaries. For policy understanding, rely on scientific assessments and complete datasets rather than turning one dramatic number into an unsupported conclusion.
Choosing the emissions series
A historical comparison is only meaningful when its emissions boundary is named. Datasets may cover fossil fuel and industry emissions, territorial emissions, consumption-based emissions, land-use change, or broader greenhouse-gas equivalents; those series answer different questions and cannot be swapped silently.
The calculator therefore keeps the dataset title and unit attached to the result. A change in series can alter both the amount assigned to the lifetime interval and its share of the historical total, even when the birth date stays the same. Readers should compare results only when the geographic scope, gases, activities, and observation years align.
Match birth dates to annual datasets carefully
Many public carbon datasets provide yearly totals rather than daily observations. For a birth year, the simplest transparent method includes whole reported years after the birth year or prorates the birth year by the remaining fraction. Proration creates an estimate because emissions are not evenly distributed through the year.
The latest year may be provisional or unavailable, so a live-looking counter often extrapolates from the most recent annual rate. That projected portion should be visually distinct from reported history. Display the last observed year, data release, geographic scope, and whether the current-year value is an estimate.
Present climate context responsibly
Use reputable data, preserve units, and link to methodology. Explain revisions when a provider updates historical estimates. Avoid sensational claims based on a single percentage, and do not mix tonnes of carbon with tonnes of carbon dioxide without conversion. A result card should fit the source definition in plain language.
The calculation can support learning about how quickly emissions accumulated during different eras. It cannot attribute responsibility, forecast climate impacts, or replace policy analysis. Showing both the reported interval and uncertainty from extrapolation gives users a more accurate picture than a rapidly moving counter with no visible basis.
How to reproduce the data comparison
Use one published annual series and note its units, geography, emissions scope, and revision date. Apply the documented fraction for the birth year, sum the observed annual values, and keep any projected latest-year portion separate. Another reader using the same dataset release should be able to reproduce the result.
For an annual change comparison, compare the birth-year annual value with the latest observed annual value using the standard percentage-change formula. A cumulative lifetime amount instead sums annual emissions; it is not a percentage increase. Keep the terminal observation year with each figure.
Check a few annual values against the provider's chart or downloadable table. Historical figures may change when a dataset is revised, so two saved results from different releases can legitimately differ. The source version and scope explain that difference more clearly than a generic citation alone.
Questions the result should answer
From the result alone, identify which emissions are included, whether the geography is world or country, the first and last observed years, how partial years were handled, and whether a projected portion is present. If any of those are hidden, the apparent precision is difficult to evaluate.
Keep a compact source line and dataset retrieval date with any saved result. A person's birth date marks the start of the comparison; it did not cause the emissions shown. This framing connects an individual timeline to public history without assigning personal responsibility for a global total.
Key takeaway
A lifetime CO2 context result must name its dataset, geography, emissions scope, units, observed years, partial-year rule, and any projection. Keep annual change, cumulative amount, and share of historical emissions as separate calculations with separate denominators. Do not call a date-based global total the user's personal emissions or imply causal responsibility. Version the source, check revisions, and distinguish reported history from a live estimate. With those safeguards, the feature can place a personal timeline beside public climate data without turning a complex record into an unsupported personal claim. Preserve the retrieval date when exporting the result. Keep tonnes of carbon dioxide distinct from tonnes of carbon.
Sources and further reading
These references support the calendar rules, cultural context, or public-data definitions discussed in this guide.
- Our World in Data: CO2 emissionsHistorical emissions explanations, charts, and underlying datasets.
- Global Carbon Project: Global Carbon BudgetScientific estimates and methodology for the global carbon budget.
- IPCC: AR6 Synthesis ReportAssessment context for greenhouse gas emissions and climate change.